
Understanding Our Changing Climate
Explore the latest data and visualizations on climate change trends, from global temperature rise to sea level changes and extreme weather events.
Climate Change: The Defining Challenge of Our Time
Climate change is altering our planet in unprecedented ways. Through data visualization and scientific research, we can better understand these changes and work toward solutions. This platform brings together key climate trends to help you explore the evidence and impacts of our changing climate.
Key Climate Visualizations
These visualizations highlight critical climate data, helping to illustrate the scope and scale of our changing planet.
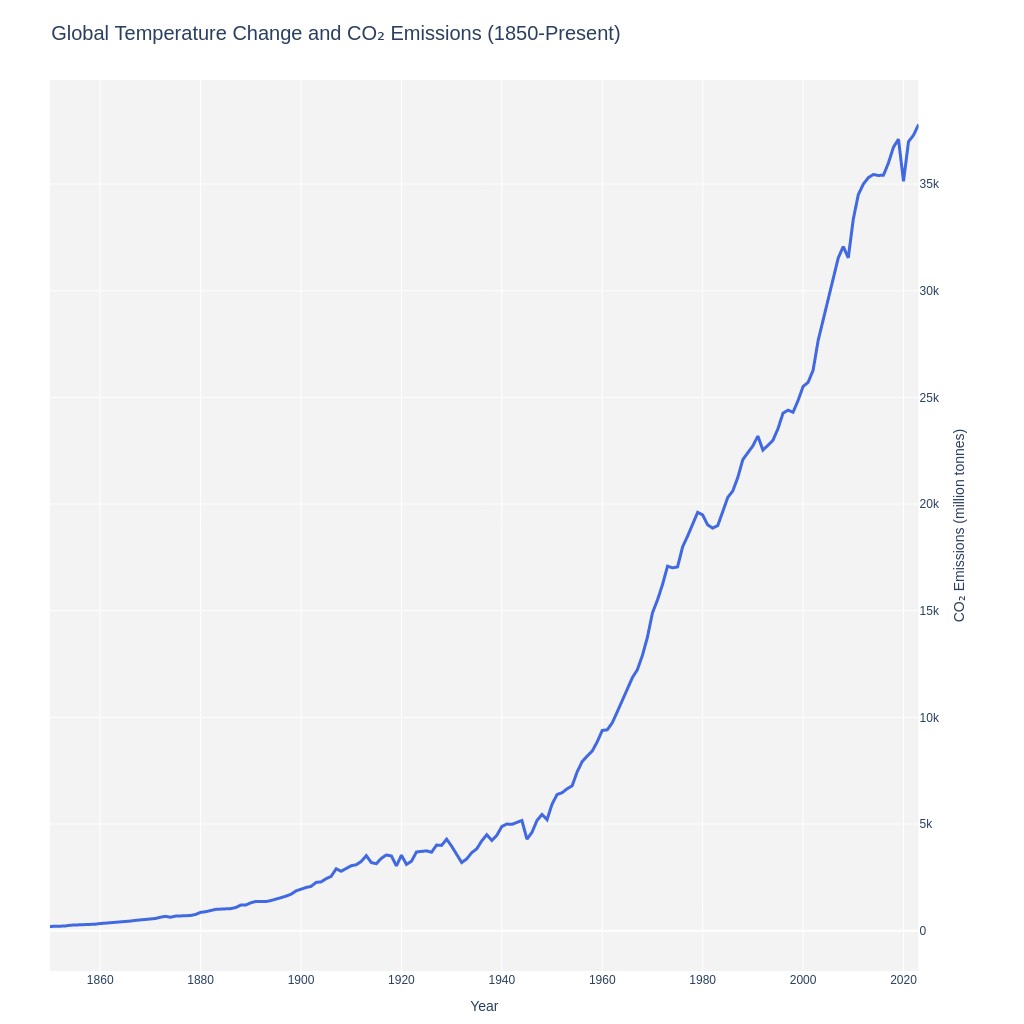
Temperature & CO₂ Trends
Global temperature change and CO₂ emissions from 1850 to present, showing the correlation between emissions and warming.
Explore Temperature Data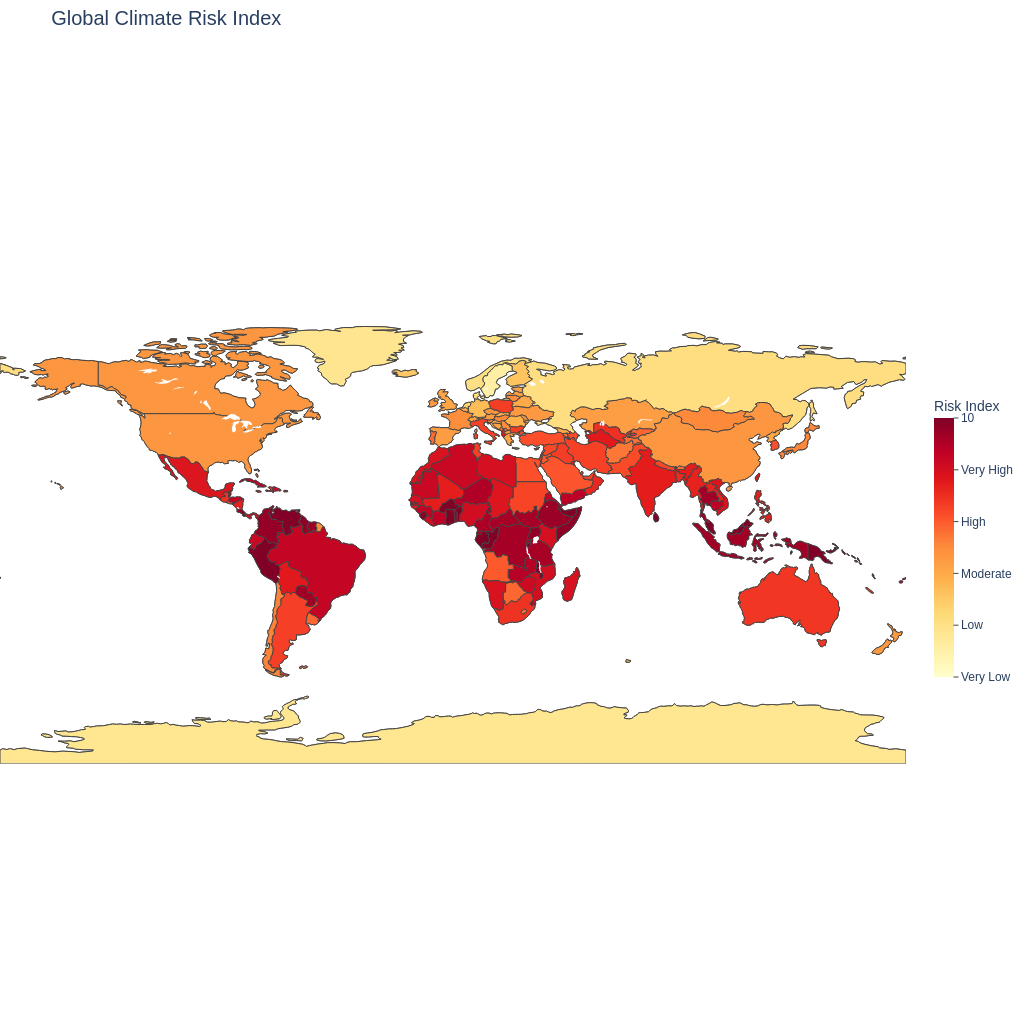
Global Climate Risk Index
Map showing vulnerability across regions, highlighting areas most at risk from climate change impacts.
Explore Risk Data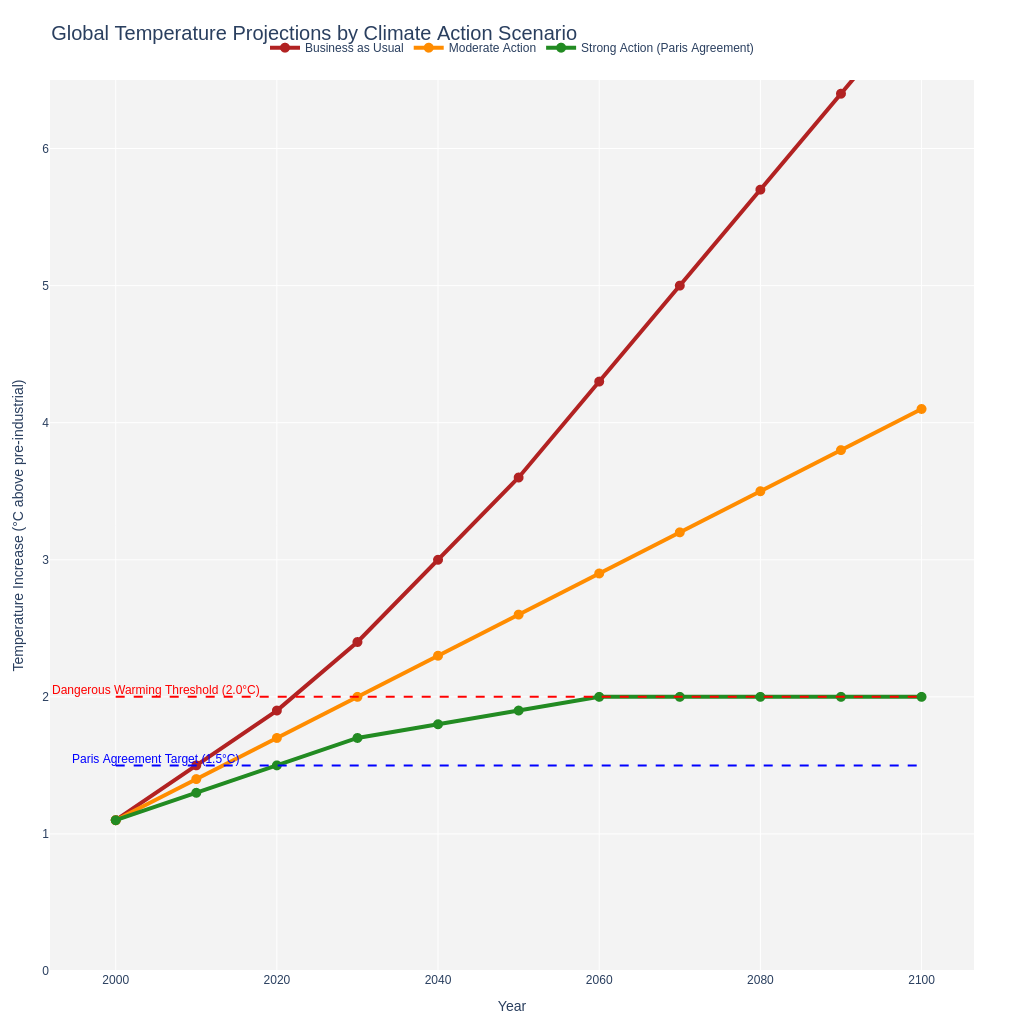
Future Scenarios
Temperature projections under different climate action scenarios, showing potential futures based on our choices today.
Explore ScenariosExplore Climate Trends
Dive deeper into specific climate change trends with detailed data, visualizations, and analysis.
Global Temperature Changes
Earth's temperature has risen by 1.1°C since pre-industrial times, with the last decade being the warmest on record.
ExploreSea Level Rise
Global sea levels have risen 8-9 inches since 1880, with the rate of rise accelerating in recent decades.
ExploreExtreme Weather Events
Climate change has led to increased frequency and intensity of extreme weather events worldwide.
ExploreGreenhouse Gas Emissions
CO₂ levels have reached 425 ppm in 2024, the highest in human history, driving global warming.
ExploreIce Sheet & Glacier Melt
Greenland and Antarctica are losing billions of tons of ice annually, contributing to sea level rise.
ExploreOcean Acidification
Ocean pH has decreased by 0.1 units since the industrial revolution, threatening marine ecosystems.
ExploreUnderstanding Leads to Action
Climate data helps us understand the challenges we face and informs the solutions we need. Explore the trends to see how our planet is changing and what it means for our future.
Start Exploring