Greenhouse Gas Emissions
Greenhouse gas emissions, particularly carbon dioxide from fossil fuels, are the primary driver of climate change.
Key Statistics
Global Emissions (2023)
0 GtCO₂e
Total global emissions reached approximately 53 billion metric tons of CO₂ equivalent in 2023.
CO₂ Concentration
0 ppm
Atmospheric CO₂ concentrations reached around 425 ppm in 2024, the highest in human history.
Emissions Reduction Needed
0%
The IPCC emphasizes the need for at least a 43% reduction in global emissions by 2030 to limit warming to 1.5°C.
Global CO₂ Emissions Trends
Data source: Our World in Data, 2024. CO₂ emissions from fossil fuels have increased by over 60% since 1990.
Atmospheric CO₂ Concentration
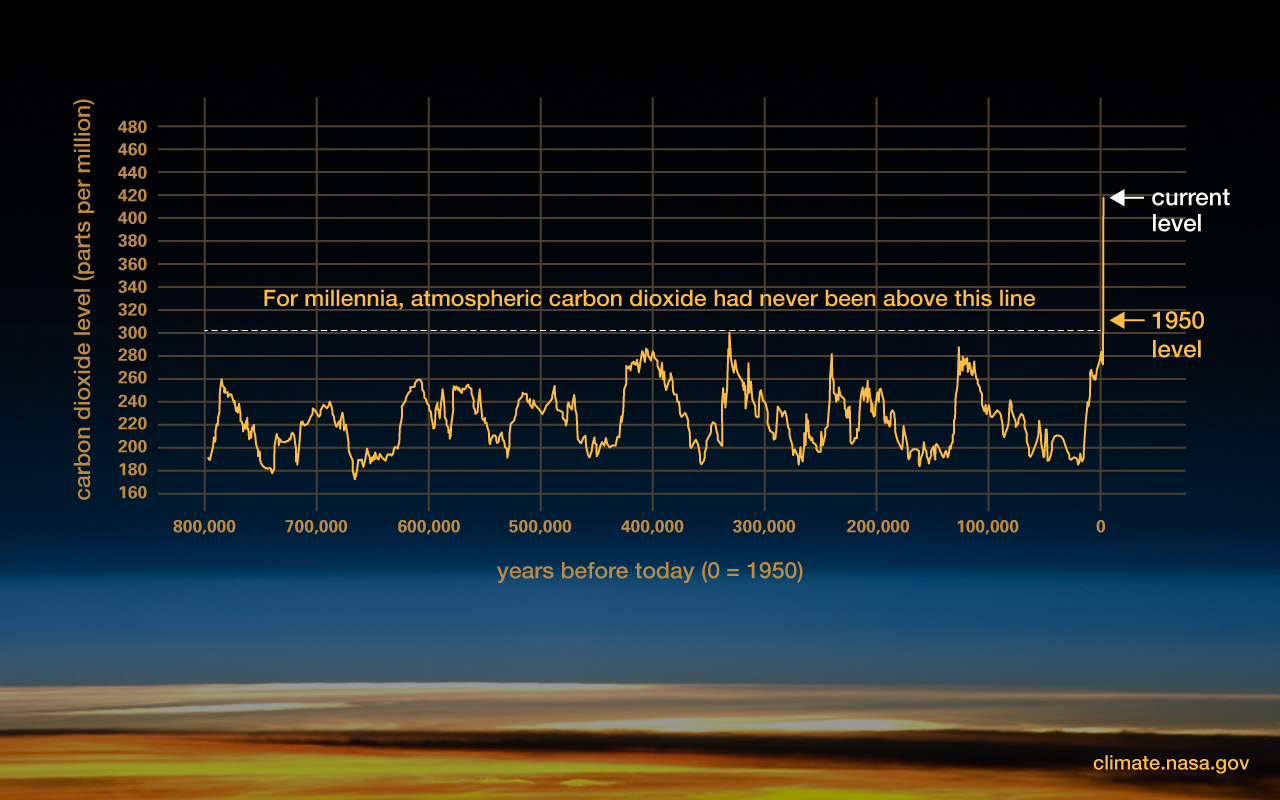
NASA's visualization of atmospheric CO₂ concentration over the past 800,000 years, showing the unprecedented rise in recent decades due to human activities.
Sectoral Contributions
Emissions by Sector
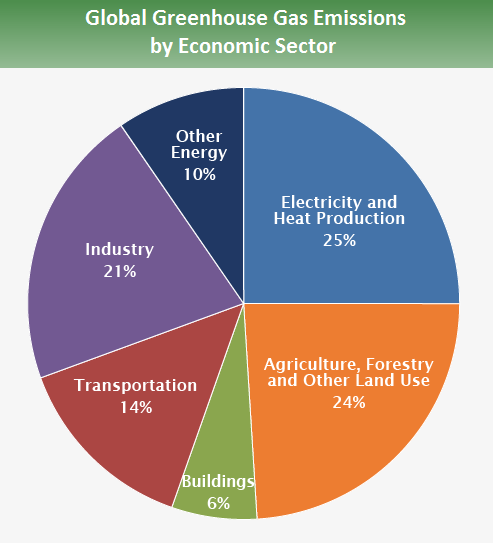
The energy sector, including electricity generation and transportation, is the largest contributor to greenhouse gas emissions globally.
Emissions by Gas Type
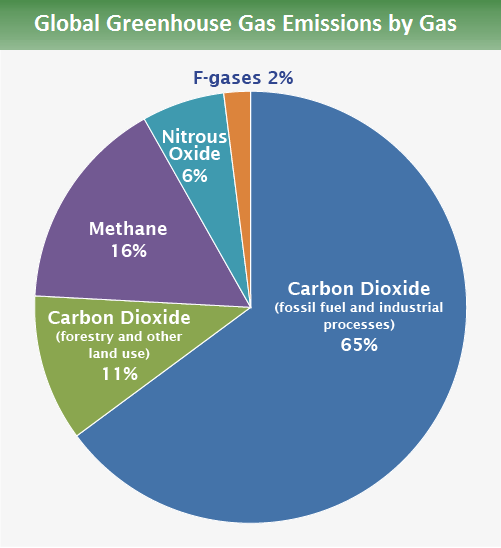
Carbon dioxide (CO₂) is the dominant greenhouse gas, but methane (CH₄) and nitrous oxide (N₂O) also play significant roles in climate change.
Key Greenhouse Gases
Carbon Dioxide (CO₂)
74% of total emissions
- • Primary source: Fossil fuel combustion
- • Atmospheric lifetime: 300-1,000 years
- • Current concentration: ~425 ppm
Methane (CH₄)
20-25% of radiative forcing
- • 28× warming potential of CO₂ (100 years)
- • Sources: Livestock, rice paddies, fossil fuels
- • Atmospheric lifetime: ~12 years
Nitrous Oxide (N₂O)
6-7% of greenhouse gases
- • 265× warming potential of CO₂ (100 years)
- • Sources: Agriculture, fertilizer use
- • Atmospheric lifetime: ~121 years
Fluorinated Gases
Small but potent contribution
- • Up to 23,000× warming potential of CO₂
- • Sources: Industrial processes, refrigeration
- • Atmospheric lifetime: Up to 50,000 years
Future Projections and Climate Goals
Current policies are insufficient to meet climate goals, with projections indicating a 24 GtCO₂e gap to meet the 1.5°C target. Achieving net-zero by 2050 requires doubling investments in renewable energy and accelerating decarbonization across all sectors.
1.5°C Pathway
- • 43% emissions reduction by 2030
- • Net-zero CO₂ by 2050
- • Rapid phase-out of fossil fuels
- • Massive scale-up of renewables
2°C Pathway
- • 25% emissions reduction by 2030
- • Net-zero CO₂ by 2070
- • Significant but slower transition
- • Higher climate risks accepted
Current Trajectory
- • Heading toward 2.5-2.9°C warming
- • Emissions still rising in many regions
- • Insufficient policy implementation
- • Severe climate impacts likely
Causes and Impacts
Primary Causes
- Energy Production: Burning of fossil fuels (coal, oil, natural gas) for electricity, heat, and transportation.
- Industrial Processes: Manufacturing, cement production, and chemical processes that release greenhouse gases.
- Agriculture and Land Use: Deforestation, livestock production, rice cultivation, and fertilizer use.
- Waste Management: Landfills and waste treatment produce methane and other greenhouse gases.
Key Impacts
- Climate Change: Rising global temperatures, sea level rise, and more frequent and intense extreme weather events.
- Health Impacts: Air pollution from fossil fuel combustion causes respiratory and cardiovascular diseases, while climate change exacerbates heat-related illnesses.
- Economic Impacts: Climate change driven by greenhouse gas emissions is projected to cause significant economic damage through reduced agricultural yields, infrastructure damage, and decreased labor productivity.
- Ecosystem Disruption: Changes in species distributions, phenology, and interactions, leading to biodiversity loss and ecosystem degradation.